Survey analytics
Survey analytics are good for two things in Command AI:
- Doing the usual nudge analytics job of making sure your surveys are being completed and aren’t backfiring by annoying your users
- Letting you see the results of your handiwork — the actual responses from users
Overview page

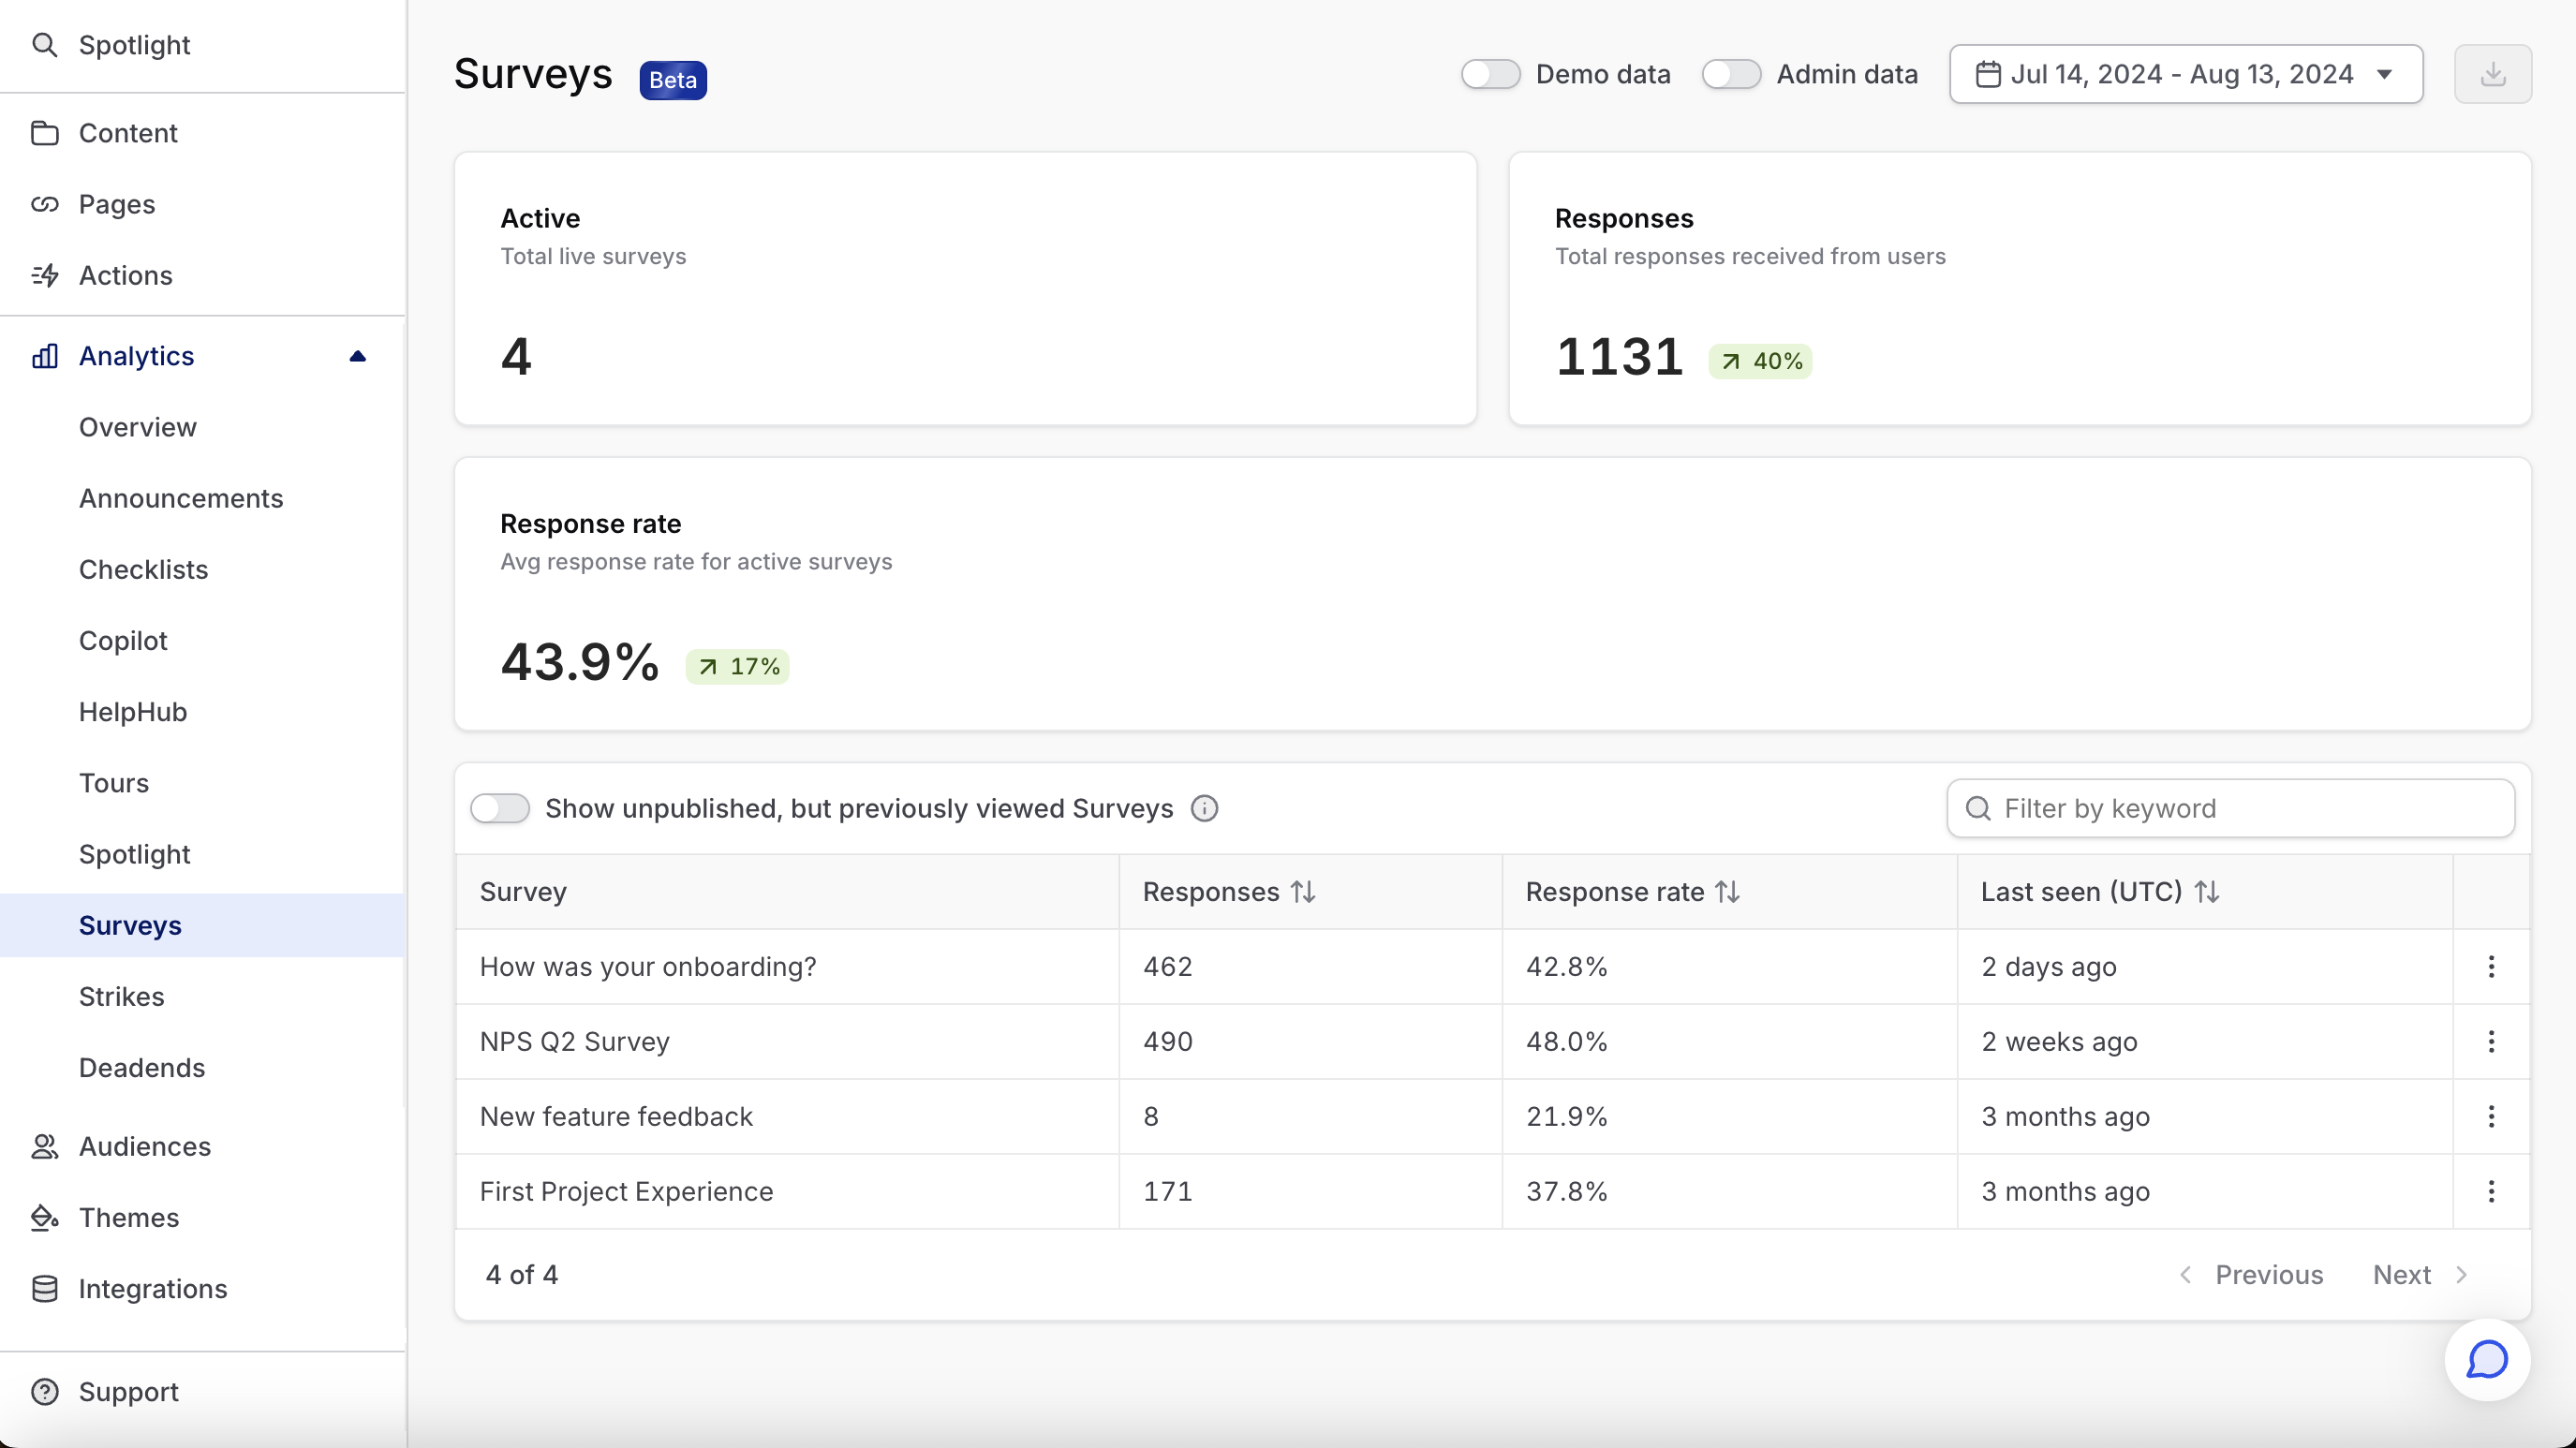
Active surveys
These are the number of surveys that are currently published to users. This represents the number of announcements that are capable of generating impressions and responses.
Responses
This represents the total number of responses in the period you currently have selected (via the selector in the top right). A response is a response to any survey block, meaning a single survey can generate multiple responses. For example, let’s say you have a survey with 3 input blocks (a “3-step” survey). Whenever a user submits this survey, it will register 3 responses.
Of course, if your survey targeting is setup to show the same survey to a user multiple times, the same user can generate multiple responses.
Note that responses include only submitted responses; situations where users filled out a survey block but didn’t submit the actual survey (by clicking the last CTA) are registered as events but not captured in this dashboard.
Completion rate
Across all the sessions in your period, what percent ended with the user actually completing the survey. Completion means they clicked the CTA at the end to formally submit their results.
Surveys table
Here you can see all your currently active surveys (toggle Show unpublished surveys to show all your surveys). Use this table to drill into a specific survey or pinpoint surveys with particularly low completion rates for troubleshooting.
Survey drilldown
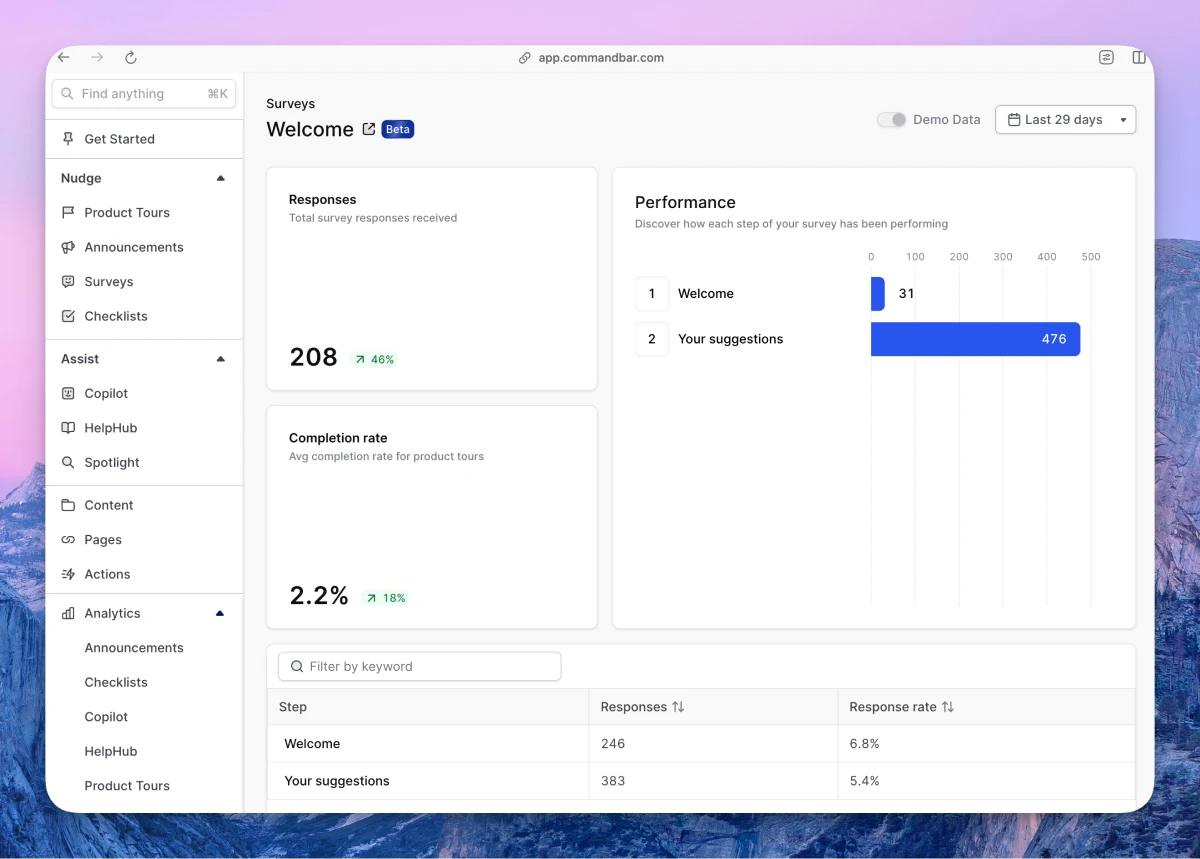
Clicking on any survey in the table at the bottom of the overview page will bring up a drilldown page. This page will show you metrics related to this specific survey as well as the survey’s responses.

Responses
The total number of responses for this survey in the selected period. To reiterate, a single survey can generate multiple responses, since a response is counted for every survey question (or “block”).
Completion rate
Across all unique views for this survey in the specific period, how many were completed (i.e. submitted).
Performance
This chart lets you pinpoint dropoff in your survey. Dropoff means the user left the survey at this step, either by closing the survey explicitly or exiting the page while it was open. Dropoff occurs because the step didn’t keep the user’s attention. The numbers next to the columns represent unique users who have viewed that step.
Viewing results
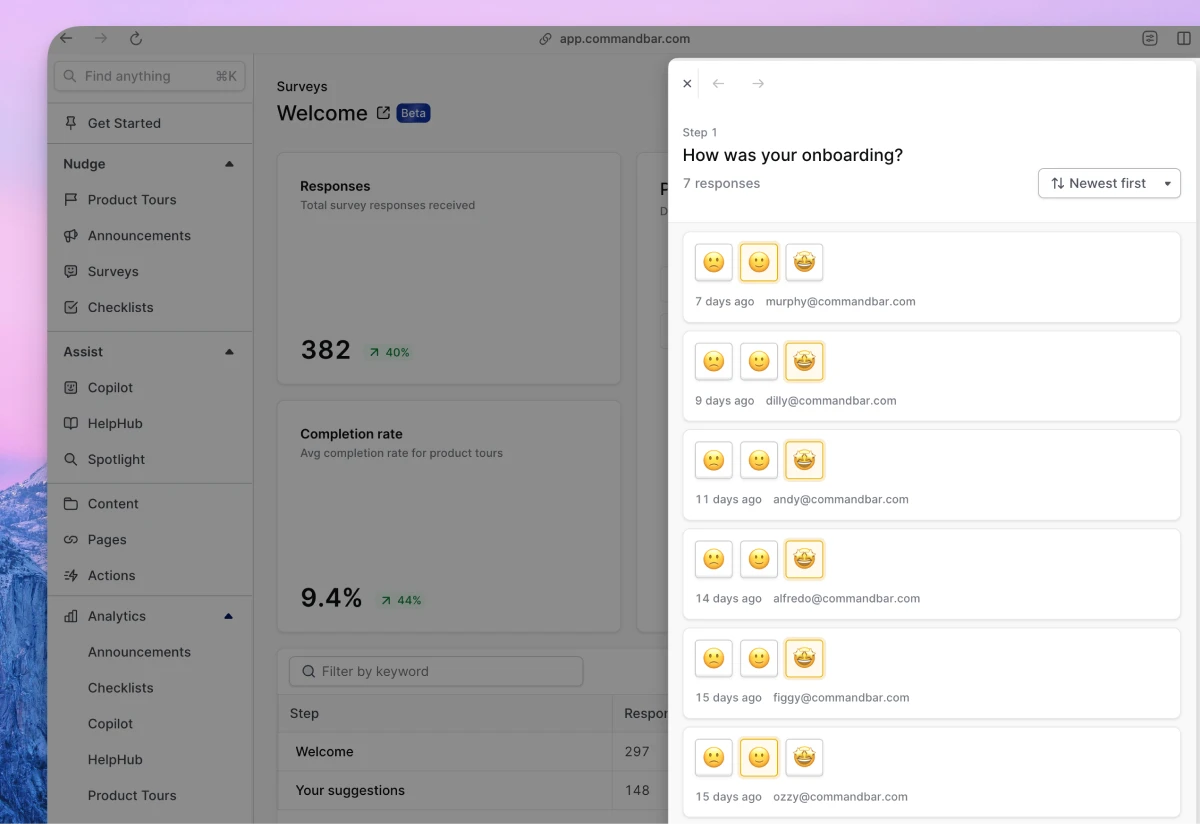
You’ve made it this far and still can’t see the results of your survey! The table at the bottom of this page has what you seek, organized by step. Click a step to see the responses to this step of your survey. You’ll see the user id of the submission along with the datetime when it was submitted.

Response rate in this table corresponds to the rate at which users fill out the step when they encounter it.
While you’re here, we’ll plug a few other ways to view survey results:
- Connect the Slack integration to pipe survey results into a Slack channel as they are submitted
- Integrations: to send your survey results to a destination like a CDP or an Analytics product (did you hear we aren’t one?)
- Custom event handler: to send your survey wherever Javascript can take it
Views
This shows every user who has had at least one impression of the survey, along with the outcome (whether they dismissed, generated a strike, completed, or abandoned mid-way).
Downloading survey result data
You can download survey results using the download button in the top-right of any Analytics page. When you open a specific survey in analytics there will be two options:
- Table results
- Survey responses
Table results includes info about:
- nudge_id
- nudge_slug
- is_live
- total_responses
- completion_rate
- last_shown
Survey responses includes:
- nudge_step_id
- response
- created_timestamp
- end_user